
Bitcoin High Time Frame Price Action
Bitcoin High Time Frame Price Action
A Monthly Look into Bitcoin's Price Structure: Part 1

What this series is: A guide to navigating BTC’s PA (Price Action) and HTF (High Time Frame) Structure.
What this series is not: A guide to trading BTC.
Meat and Potatoes
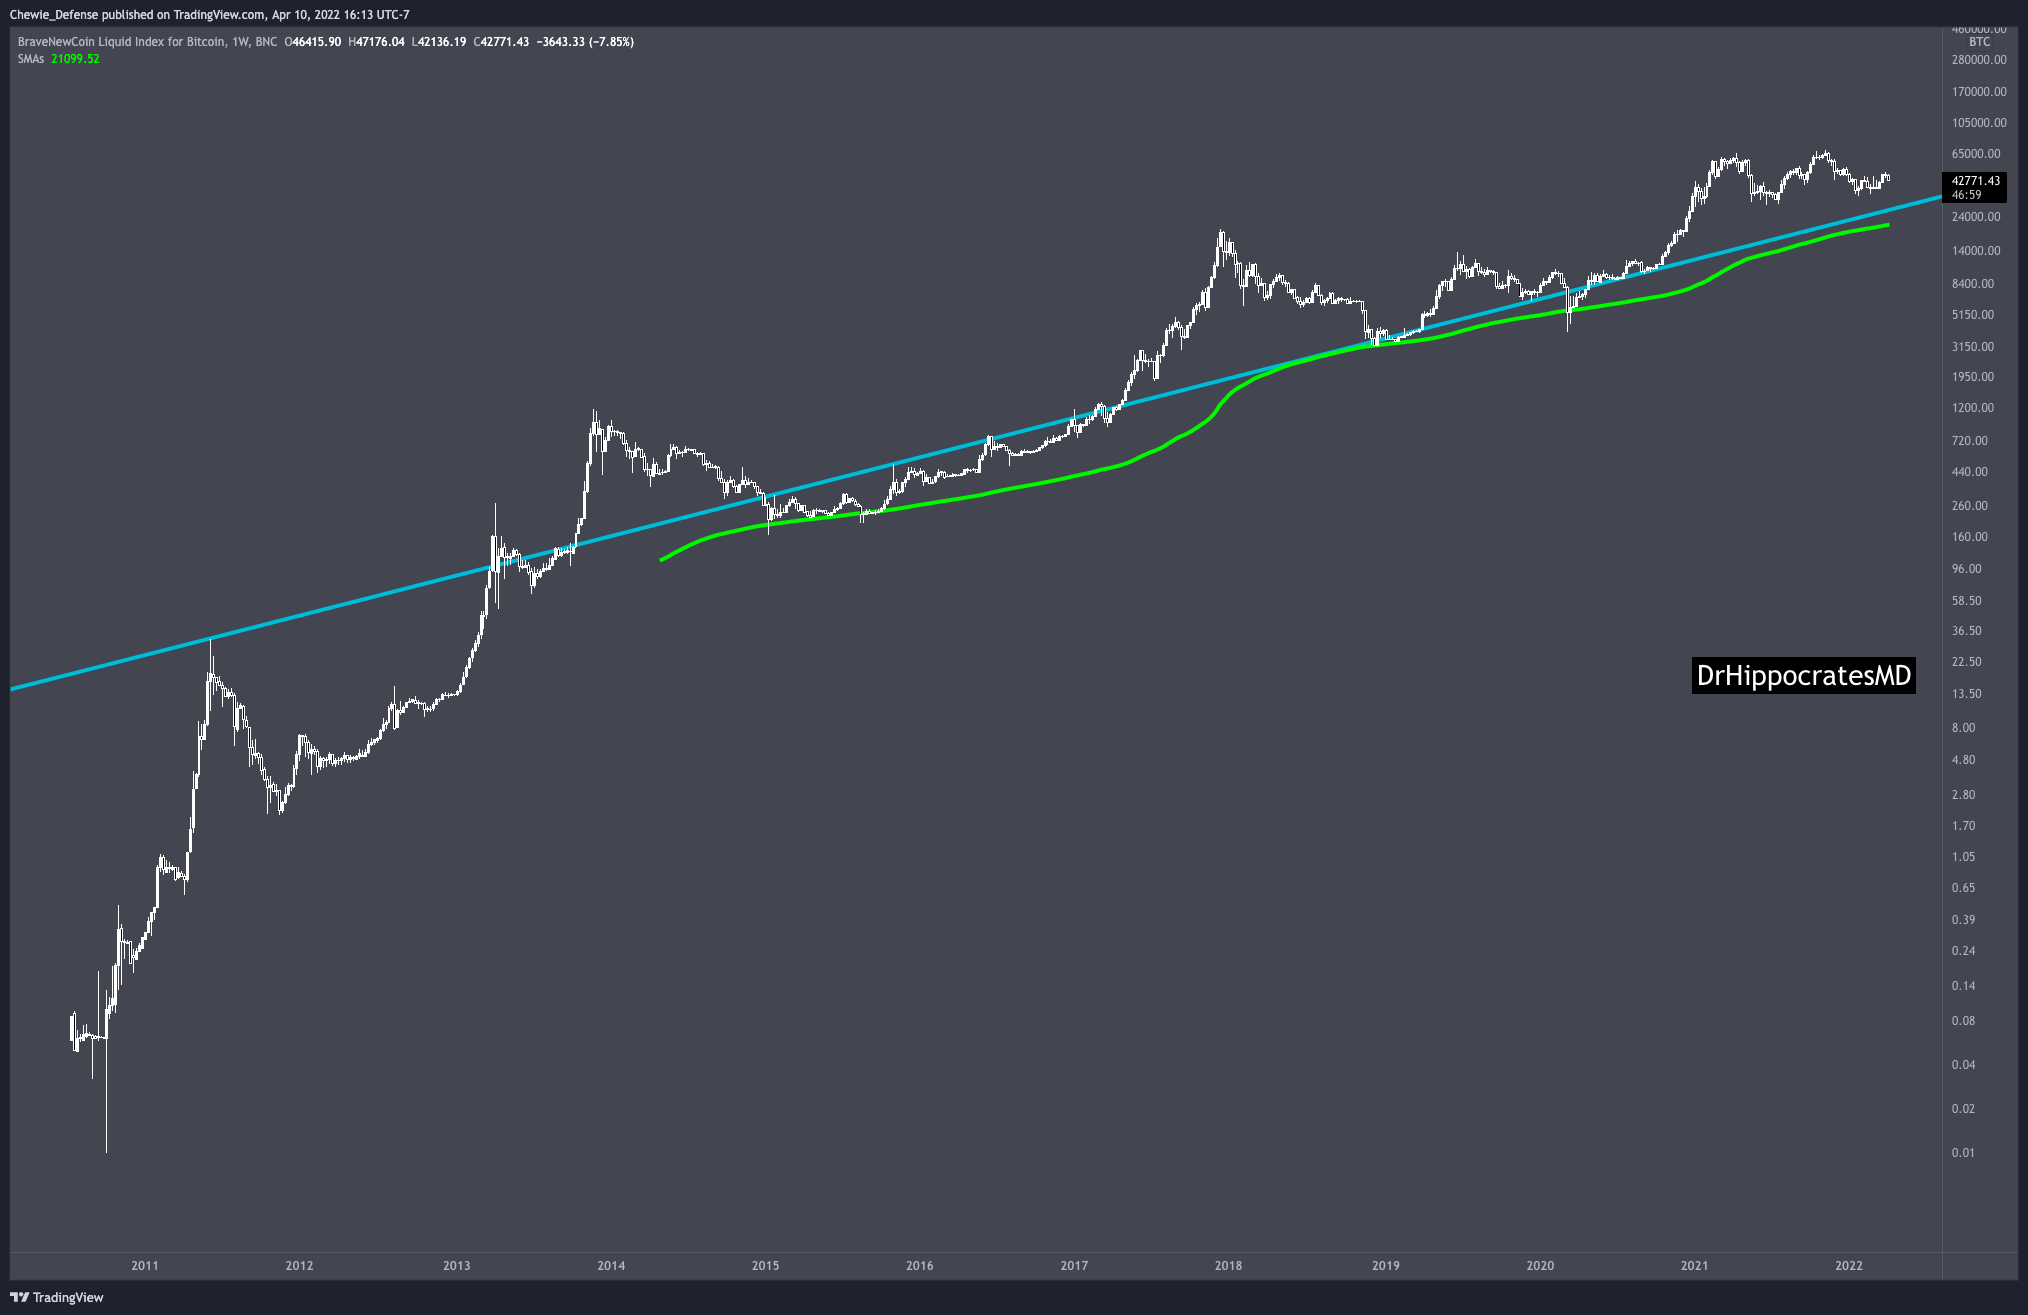
Most people are familiar with Bitcoin’s 200 Week Moving Average. It often marks the ultimate buying opportunity.
Something I never see talked about is this 11 year trend (blue). It shows how BTC has only gotten stronger cycle over cycle at maintaining higher prices. I have yet to see anyone else point out this near perfect 11 year trend.
It has evolved from capping the bull market top (2011), capping the bear market top (2015-2016) to holding the bear market bottom (2018-2019)
Trend line currently sits at 26k but will be 28k in about a month. (I think everyone is familiar with the importance of 28k nowadays)
Weekly Timeframe
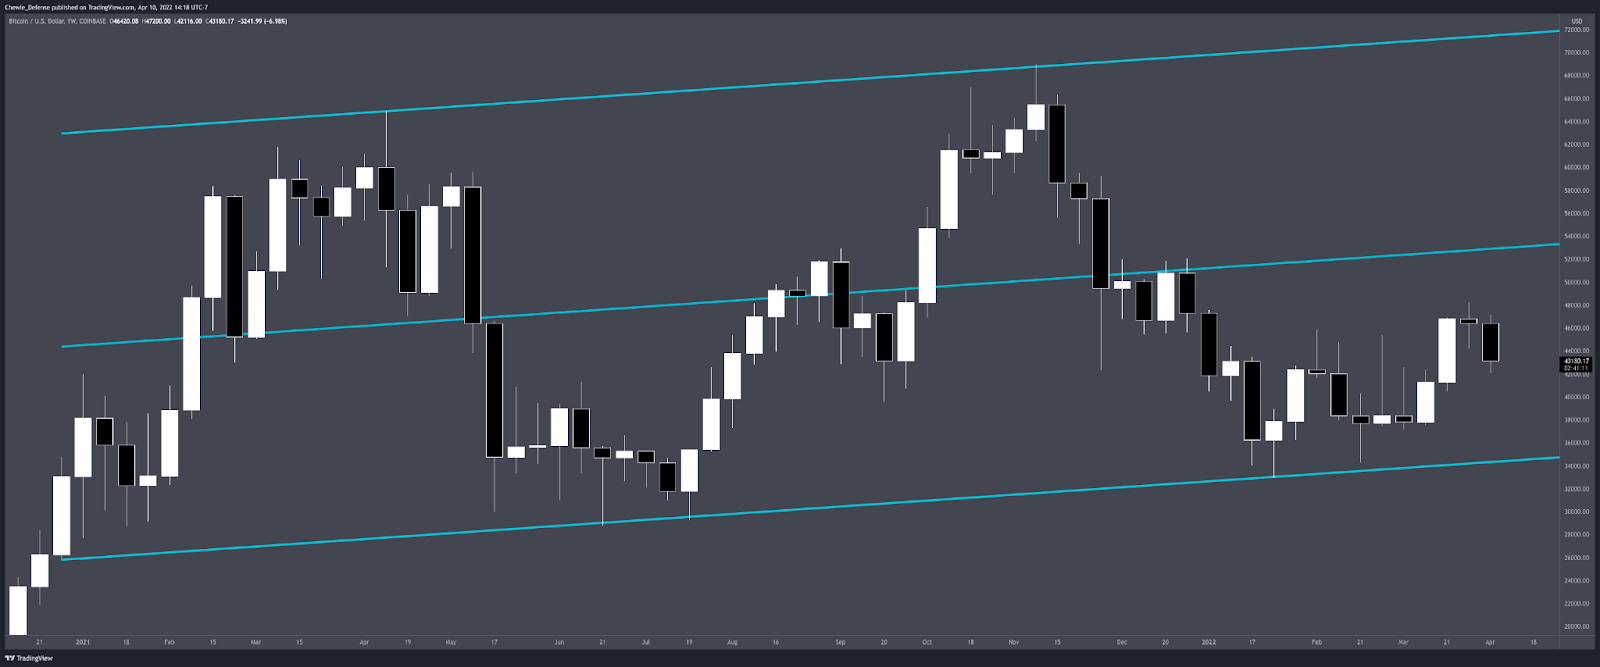
Channel of Higher Highs and Higher Lows over a 16 month range.
Very clean and getting cleaner. Let’s keep it simple here. We’ll reference this later.
3 Day Timeframe

This is the Most Important HTF chart for navigating the current PA and is the core of this write up.
We will mainly focus on 3 significant levels. 28k, 40k and 58k.
Starting left to right, let’s recap our 16 month range journey.
A) The 40k area (red) capped the ‘2017 ATH Break Rally’ and started the first major correction into our current multi-year consolidation.
40k is where tons of the BTC supply swapped hands. This can be confirmed by:
On chain whale wallet spending behavior**
Long term holder supply distribution**
Where miners took major profits**
BTC Dominance (green) Peak - Alt flow began

B) 28.7k held the bottom of this correction and ‘21 Summer lows. This corrective wave from 40 to 28 in Jan ‘21, as we’ll come to see, has shaped the majority of our price action since.
C) Short term holders got us to 58k level- that still is crucial today. The level was lost multiple times, never held. Finally, we dropped under and could not reclaim.
Backtest. Rejected. Major sell off.
April 30 - March 12, 2021 (x)
D) Summer. Where did we find support? 28k. Where did we find resistance? 40k.
Finally a breakout over 40.
Now comes the most important moment in 2021- with enough clearance of the level- we backtested 40k as support for a week straight- numerous, relentless tests and we succeeded. We just flipped a major resistance to support and this event launched us to ATHs in a furious manner.
E) At the highs we had one successful support hold of 58k on Oct 27th and guess what? New ATH again. Unfortunately the next attempt failed badly (insert macro stuff here).
Broke under. Backtest. Selloff.
Nov 19 - Dec 1, 2021 (y)
F) Consolidation Range post-Dec 4th capitulation. Support at 45.5k. (note this level) Resistance at 52k. We spent about a month in this range until the market decided it couldn’t hold 45.5 and we went back to our 40k pivot (red) as soon as 2022 rolled in. Tried to hold 40k as support as we did in Sept 2021. Got a mini bounce, but ultimately sold off. (z)
G) Direct your attention back to the Weekly Multi-Year Channel chart above. We found wick support exactly where you’d expect; along the multi-year channel.
H) Consolidation and 45.5k rejections.
I) 3 month consolidation resistance broken. Launched above 45.5k and peaked at 48. What have we learned about breakouts so far? The resistance needs to be flipped as support (see: Sept ‘21). We should be looking to hold 45.5k as support ideally to confirm that we’re ready to stay up here.
We failed the support test pretty consequentially in my opinion. 3 day candle bodies line up perfectly to the support line giving even more confidence to the importance of the 45.5k level. Bulls tried, but there wasn’t enough room.
Daily Candles
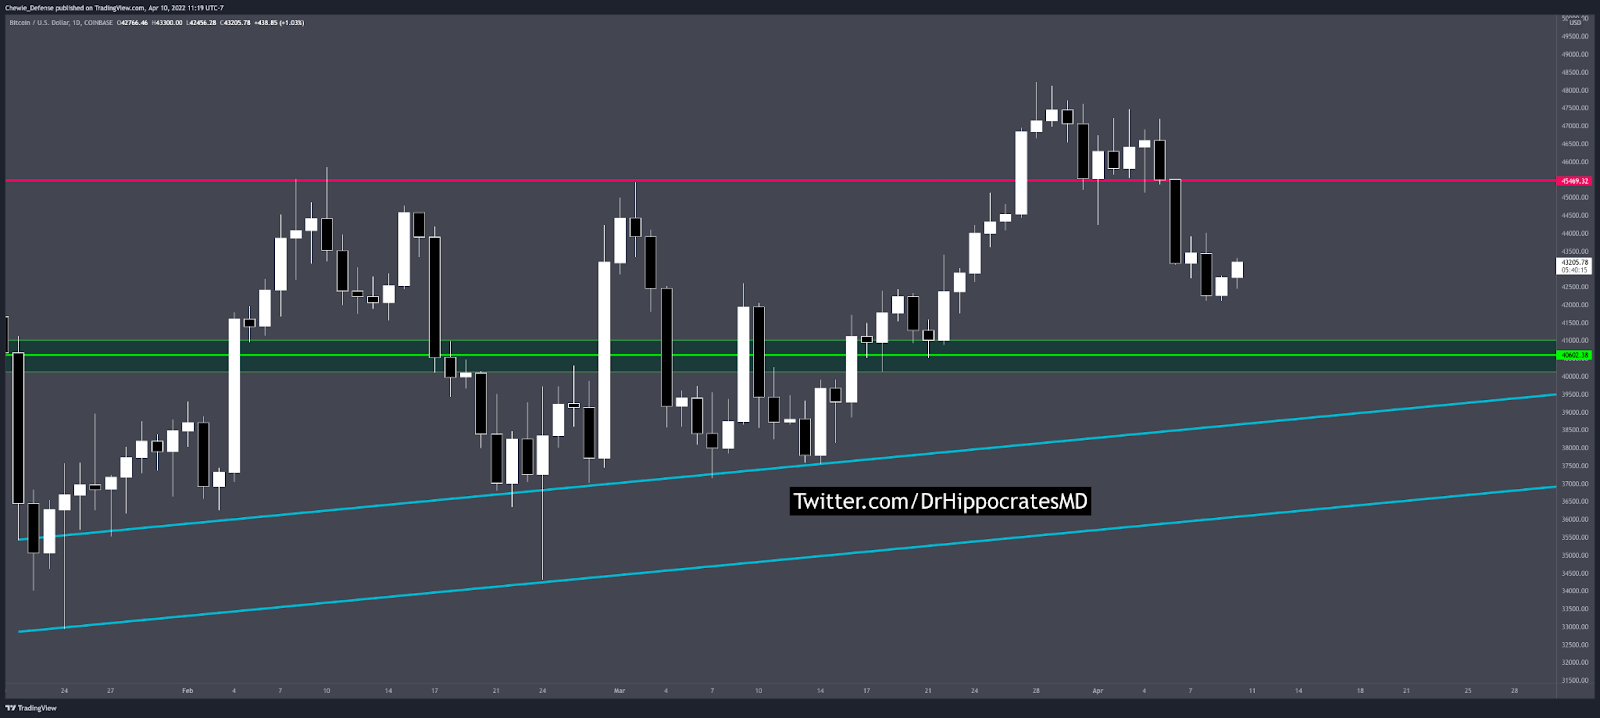
This gives an even better view of the importance that 45.5k had.
Notice how attempts to hold 45.5k were minor bounces. Notice the severity of the breakdown candle as soon as we lost it. Those of you in the PDE discord should remember how quickly my AVAX trade plan changed on this day [April 6] (BTC losing major levels invalidates many alt trades in a big way).
This chart also shows our local diagonal supports.
What Can We Learn?
If we simply apply the lessons BTC has taught us over the last 16 months, we start to take notice of the importance of PA around key levels.
If we hold 40k support on HTF we can start targeting range high - 58k.
When we find a higher support than 40k (maybe 45.5k?)- we’ll likely attempt to go to new ATHs.
When an attempt to flip resistance into support fails it attempts a backtest and draws down quickly towards the next potential support.
So, today, sitting at 43k, where is our next proven HTF support? 40k
Where have we been finding support over the last 3 months? Upper Blue Trend (currently ~39k) with wicks to multi-year channel (currently ~36k)
Where Are We Right Now?
Keep it simple. We broke over a very important level. We didn’t clear it with enough room to hold it and Bitcoin is currently looking for support. 40k? 39? 36? 28? I don’t know.
Final Notes:
Backtests. We have seen that, many times, when support fails- backtests come. Don’t be fooled by LTF (4hr) closes above. Look at all the wicks at (x) and (y). 3D and Weekly closes matter more. Weekly close over invalidates backtest rejection in my opinion.
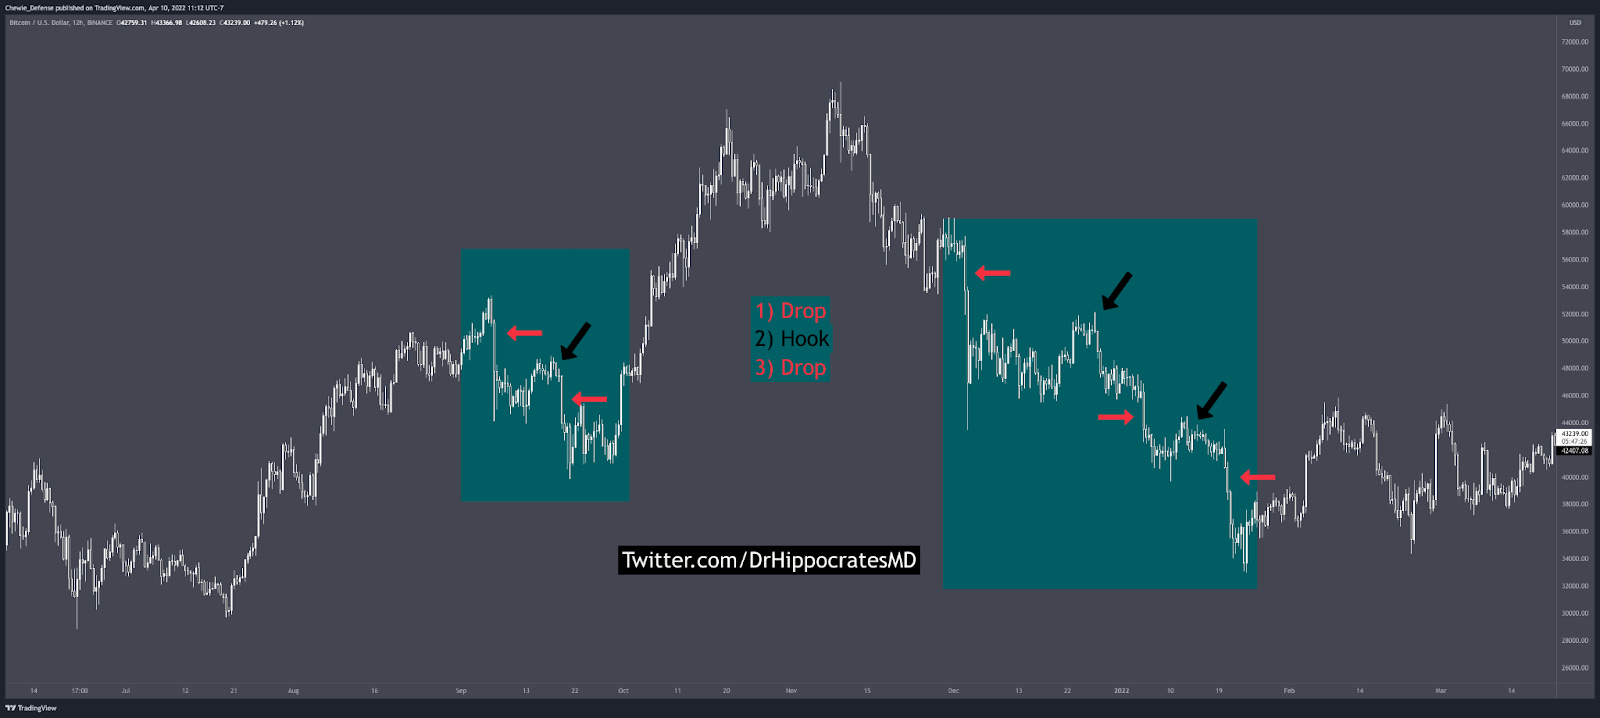
Drop-hook-drop formation (Pictured Below). This pattern often appears during a trip down to support. BTC loves to form a bullish hook upwards to bait leverage longs. This gives fuel to spot sellers to liquidate them and cause faster capitulation into support where their bids lie.
None of this is financial advice.

*If this was helpful or taught you something- consider following me on twitter.
More eyes = More criticism = More learning opportunities = More competence
**On Chain Data Source: TXMC (Analyst at Glassnode)
His Youtube Channel: https://www.youtube.com/channel/UCZoJZ2gpu0UafOEHlY6RDlg
I don’t pay for Glassnode and don’t want to steal his charts, so please go support him as well.
Great read! Thanks